

When you are just starting to generate some content for the world, you rarely think about the metrics. Does your activity really work for your personal brand well enough or not? Does it give you something? How can the result be generally expressed in some other way than a short-term impression of the number of retweets or the rating of a blog post?
At the same time, the lack of structured information about what results you achieved, thanks to this content, can lead to interesting consequences.
There will be no authorization of the result: it will seem that the result obtained is random or caused by the most recent action and not a long history.
Without a written or visualized connection between public activity and its benefits, discarding an activity at a difficult moment may be easier. Because it does not give anything, it only requires resources.
Okay, how can this very result be tracked and evaluated?
At this point, professionals (marketers) come to the aid of non-professional (those for whom this is not the primary profession) creators and distributors of content. Any decent marketer would recommend evaluating the following:
Reach. The number of views the post or speech had.
Subscribers to your channels through which you distribute your content. For example, your Twitter or blog.
Actions with publications. Reposts, comments, likes.
ER = engagement rate = ratio of actions and reach. The percentage of the audience that saw your post or speech and somehow actively interacted with it.
If you gather people somewhere, for example, to a meetup in your name or to subscribe to your newsletter, — look at the leads. It's those who filled out the application form. Also, you can measure the speed of their gathering: gathering an entire room for a meetup in a week or a month is a noticeable difference.
These metrics can be measured for each channel and content type, over different periods, for example:
You can view metrics separately for the blog posts and Twitter.
Posts and speeches: what brings you most of the views, followers, and fun?
Per month, quarter, and year... In general — in any data slice.
This allows one to:
- See the result in the sums of reach and reactions to posts, not just in a scattered pile of data spread out by the time they were received. It might look like this:
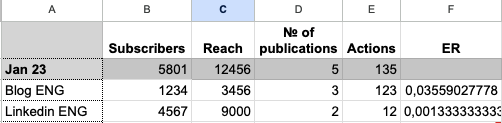
Analyze the result. Which publications have a higher ER, and which ones have a smaller one? Then look for differences between them, and strive to make more engaging publications. Do not just post in the same vein and not see the effect.
Build an overall timeline and interconnections between events. For example, someone invited you to create some project together after watching a video of you that hooked them. You were not just invited to a project after someone watched some footage with you. First, you wrote an article, then developed the idea on a podcast, then shot a video ... After this reuse of the content, working out the idea, and reaching a certain number of reach with this idea — only after that you were called somewhere. All the previous steps were also not in vain.
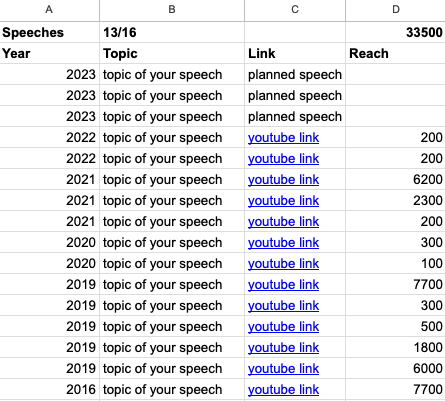
Keep data on previous successes close at hand. So it's easier to give them away. For example, send links to earlier speeches when submitting a new conference simply by the Ctrl + V Ctrl + V method, not by collecting them all over YouTube. It also makes it possible to estimate whether some new speech or an article will give you the same or better result. Or it won't work out after you will spend the same amount of energy. It might look like this:
Where can I get a template to collect my activities and count the numbers?
Here is a Google spreadsheet template for calculating such analytics, from which these screenshots are made. You can make a copy for yourself and customize it as you like.